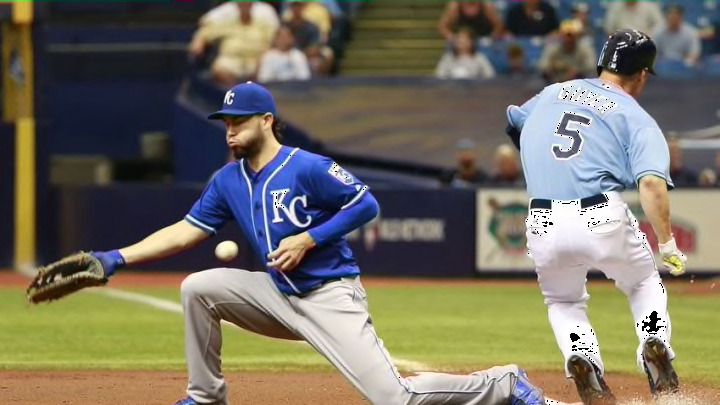
Kansas City Royals: All-Time Worst Defenders
By Scott Dillon

The Kansas City Royals have a great defense now, but that hasn’t always been the case. Who was the worst defender at each position?
Before the Royals started winning Gold Glove awards on a yearly basis back in 2011, the Royals weren’t a team built on defense. Before Alex Gordon took home a Gold Glove in 2011, the Royals only saw two Gold Glove winners in the 2000’s.
Mark Grudzielanek won a Gold Glove in 2006 and Jermaine Dye won the award in 2000. Prior to that, Bret Saberhagen won the award in 1989 with no Gold Glove winners in the 90’s. That means that the Royals three winners in each of the past three seasons account for more winners on each team than the Royals had total in the 90’s and 2000’s.
Let’s take a look back at the Royals’ worst defenders at each position. To do this, I’ll use FanGraphs TZ and UZR ratings to determine who the worst defenders were. These metrics can be a little confusing, so there is a full description of what they mean.
I’ll mostly be using the metric TZ to create this list of players. While fielding percentage would appear to be the easiest metric to use, it’s not the best metric in determining how good or bad a defender may be.
Lorezno Cain, Carlos Beltran, and Jarrod Dyson would be the three worst defenders in center field for the KC Royals if fielding percentage was used. Their speed allows them to get to more baseballs and thus creates more opportunities for errors. They’ve also saved more runs because of their range.
FanGraphs explains Total Zone (TZ) metrics with the following:
"Like UZR and DRS, TotalZone and TotalZone with Location Data are both presented as “Runs Saved”. League-average is zero, while positive scores represent above-average fielding and negative scores denote below-average fielding. TZ and TZL are both good metrics, although UZR and DRS are still considered the more accurate fielding metrics. However, UZR and DRS can only be calculated for modern-day players due to technology constraints, so TZ is the best historical fielding statistic available. If you want to compare a modern day player’s fielding with a player from the 1940s, TZ would be the statistic to use."
I’ll basically use a pro-rated approach to a players TZ numbers. No players will be on this list that didn’t total at least 1,500 innings at the position. 1500 equates to a little more than one full season of play. The players TZ will be calculated as: TZ per 1,500 of play. Because the metric is cumulative, this makes it a little more fair.
That’s probably enough technical detail for one day, so with that said, let’s get to the worst defenders ever.
Next: Pass The Buck